User Interface Guide
This page gives you a quick tour of the main areas of the AC-Hunter web interface so you know what to expect when you log in. For details on how scoring and detection work, see the Analysis Overview.
Browser Support
AC-Hunter is developed and tested on Google Chrome. Other modern browsers may work but are not officially supported.
Dashboard
The Dashboard is your starting point after logging in. It shows a ranked list of network sessions (source-destination pairs) scored by AC-Hunter, with the most suspicious activity at the top.
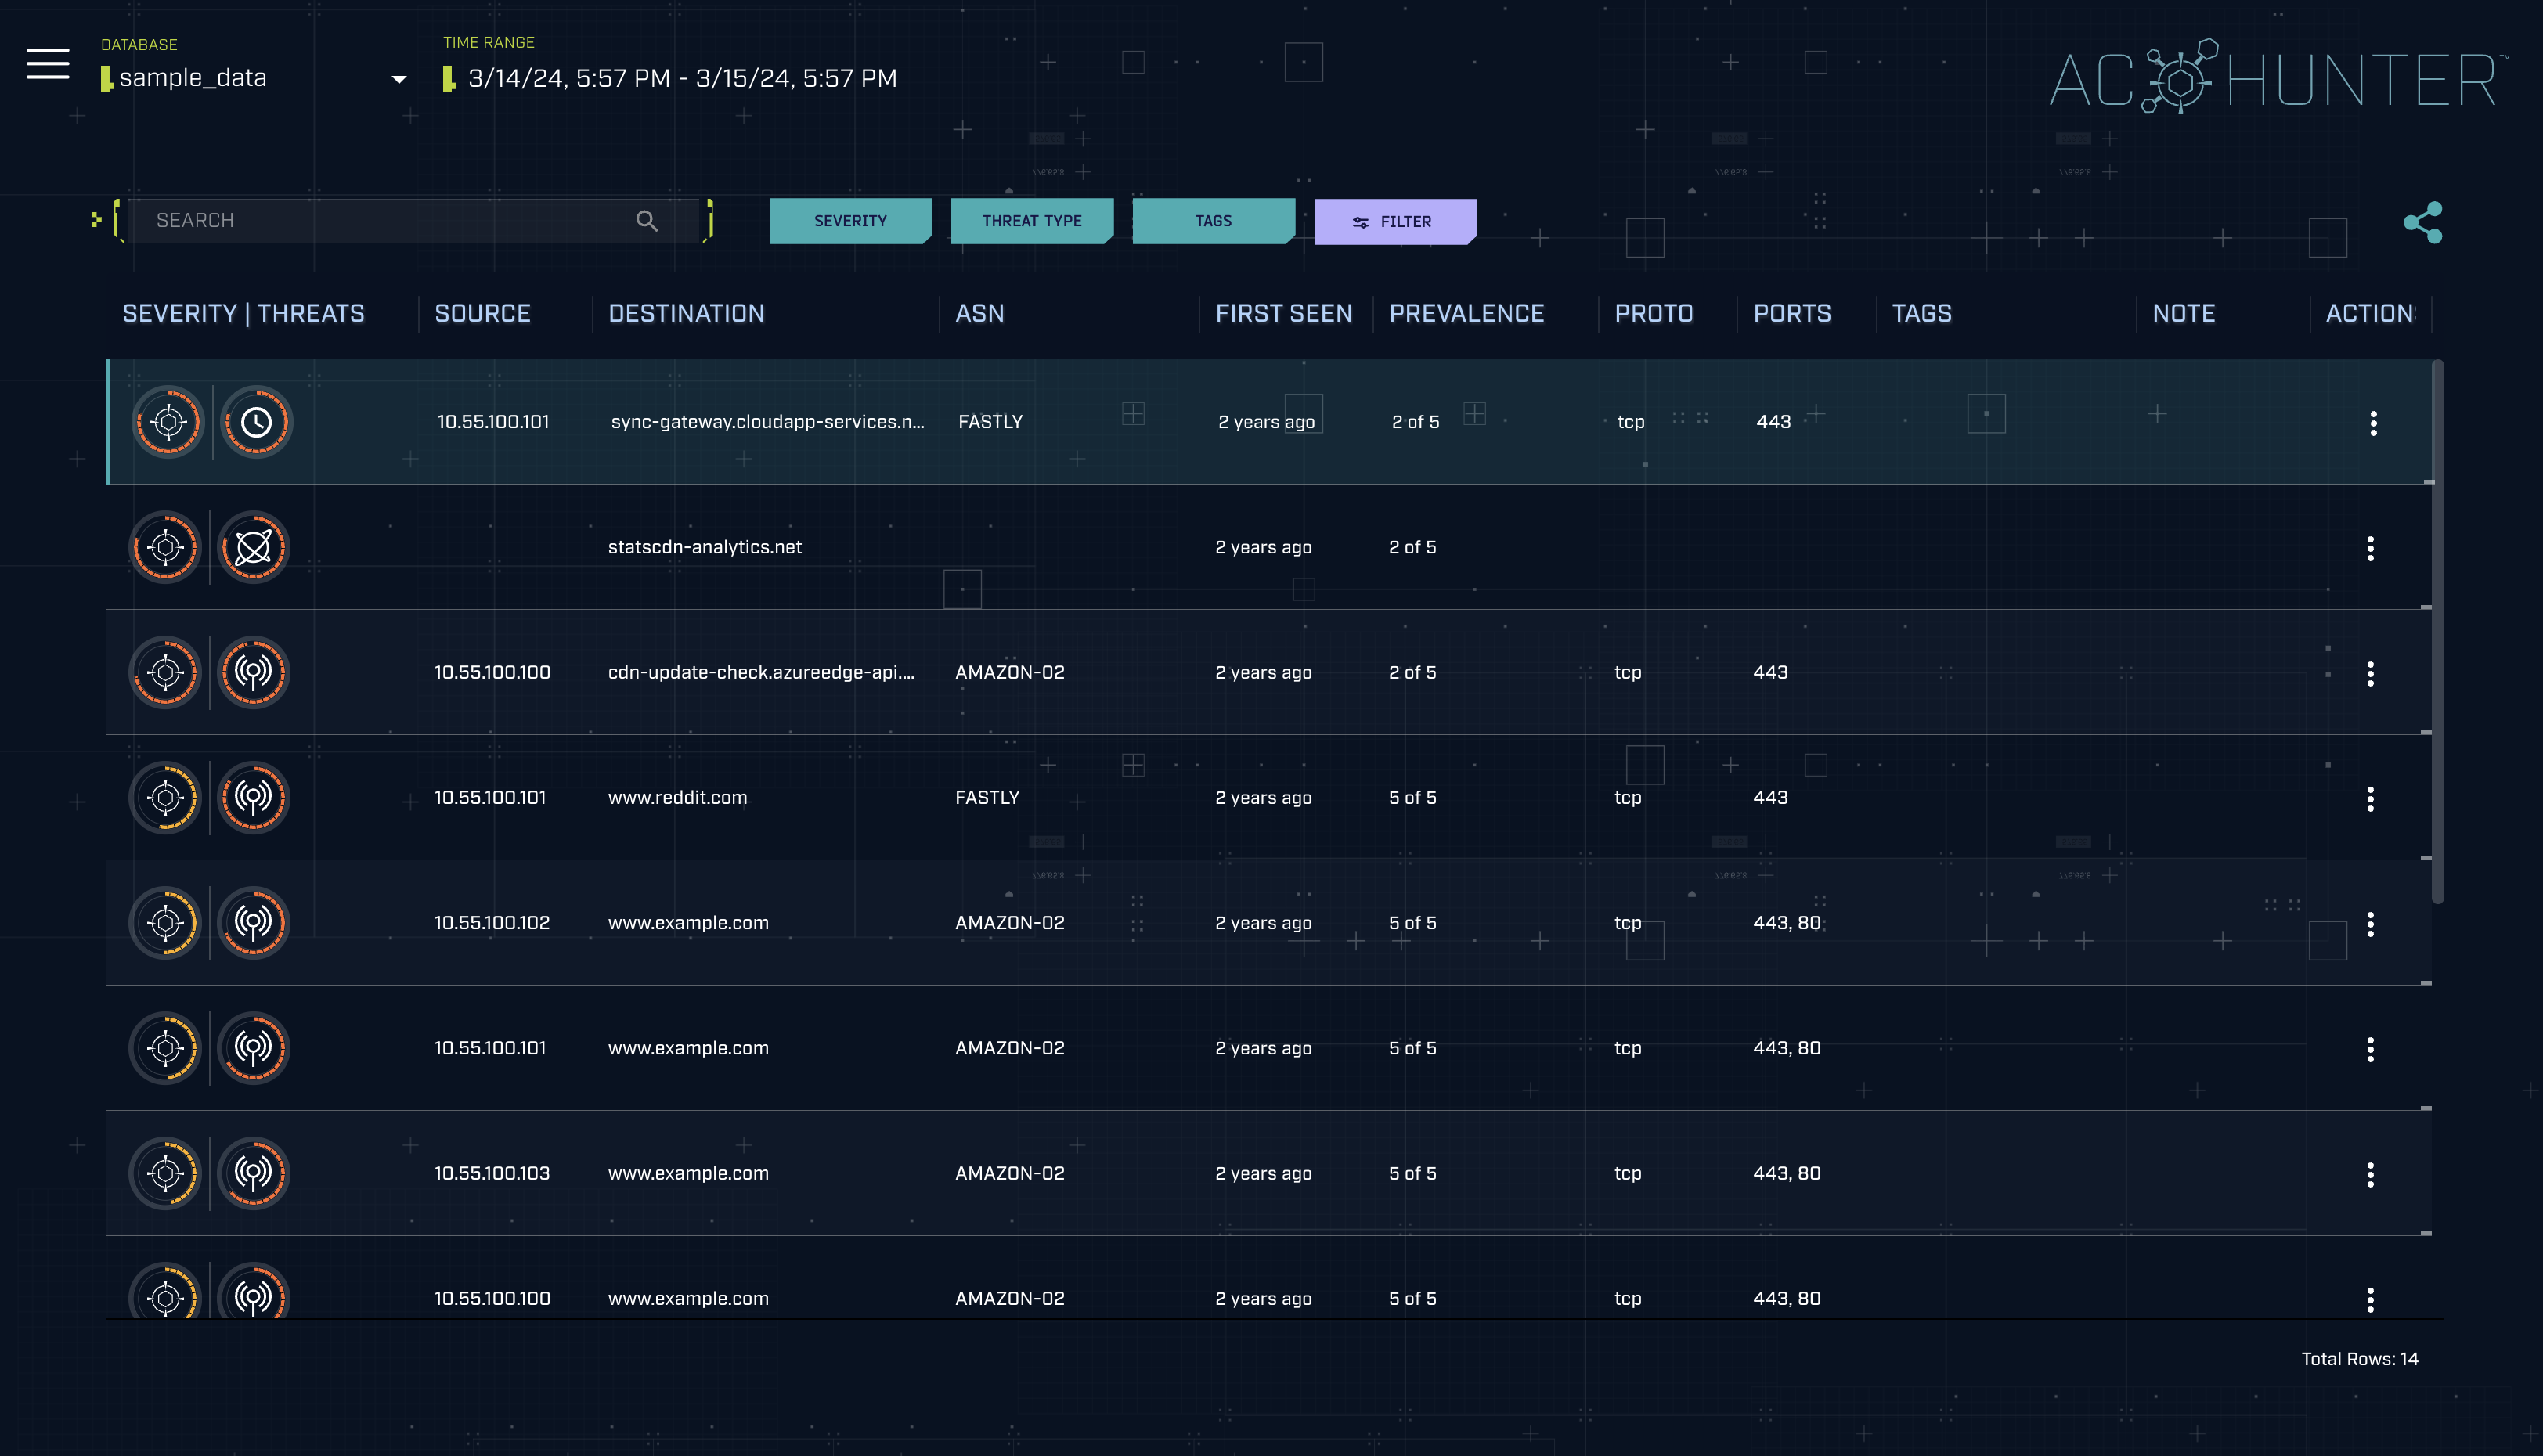
Use the controls at the top to select a database (sensor/dataset) and time range, and to filter results by severity, threat type, tags, or free-text search. Toggle View Safelisted Connections inside the filter menu to reveal connections normally hidden by your safelist.
Session rows
Each row in the table represents a single network session (a source-destination pair). The row is laid out in three areas:
Left (Threat indicators): The leading icon shows the session's overall threat severity. Next to it, individual icons represent each detection type that fired for this session (e.g. beacon, strobe, long connection, C2 over DNS, threat intel). Together these give you an at-a-glance read on why AC-Hunter flagged the session and how serious it considers the activity.
Center (Connection details): The source (internal host), destination (external host or FQDN), ASN/organization, protocol and ports, prevalence, and first-seen status. This context helps you quickly identify what the connection is and whether it looks expected for your environment.
Right (Tags, notes, and actions): These are the interactive elements of the row:
- Tags: Apply color-coded labels to track investigation status or categorize findings. You can add, remove, or create new tags directly from the row.
- Notes: Open a free-form text editor to record your observations or conclusions about the session. Notes are visible to all users.
- Actions: A menu with three options: add a tag, add a note, or add the connection to the safelist.
Double-click any row to open it in the session details view.
Sessions are ordered by score and severity so the most suspicious activity appears at the top.
Session Details View
When you open a session from the Dashboard, you land on the session details view, a dedicated page for that single source-destination pair. This is where you investigate and validate why a session was scored.
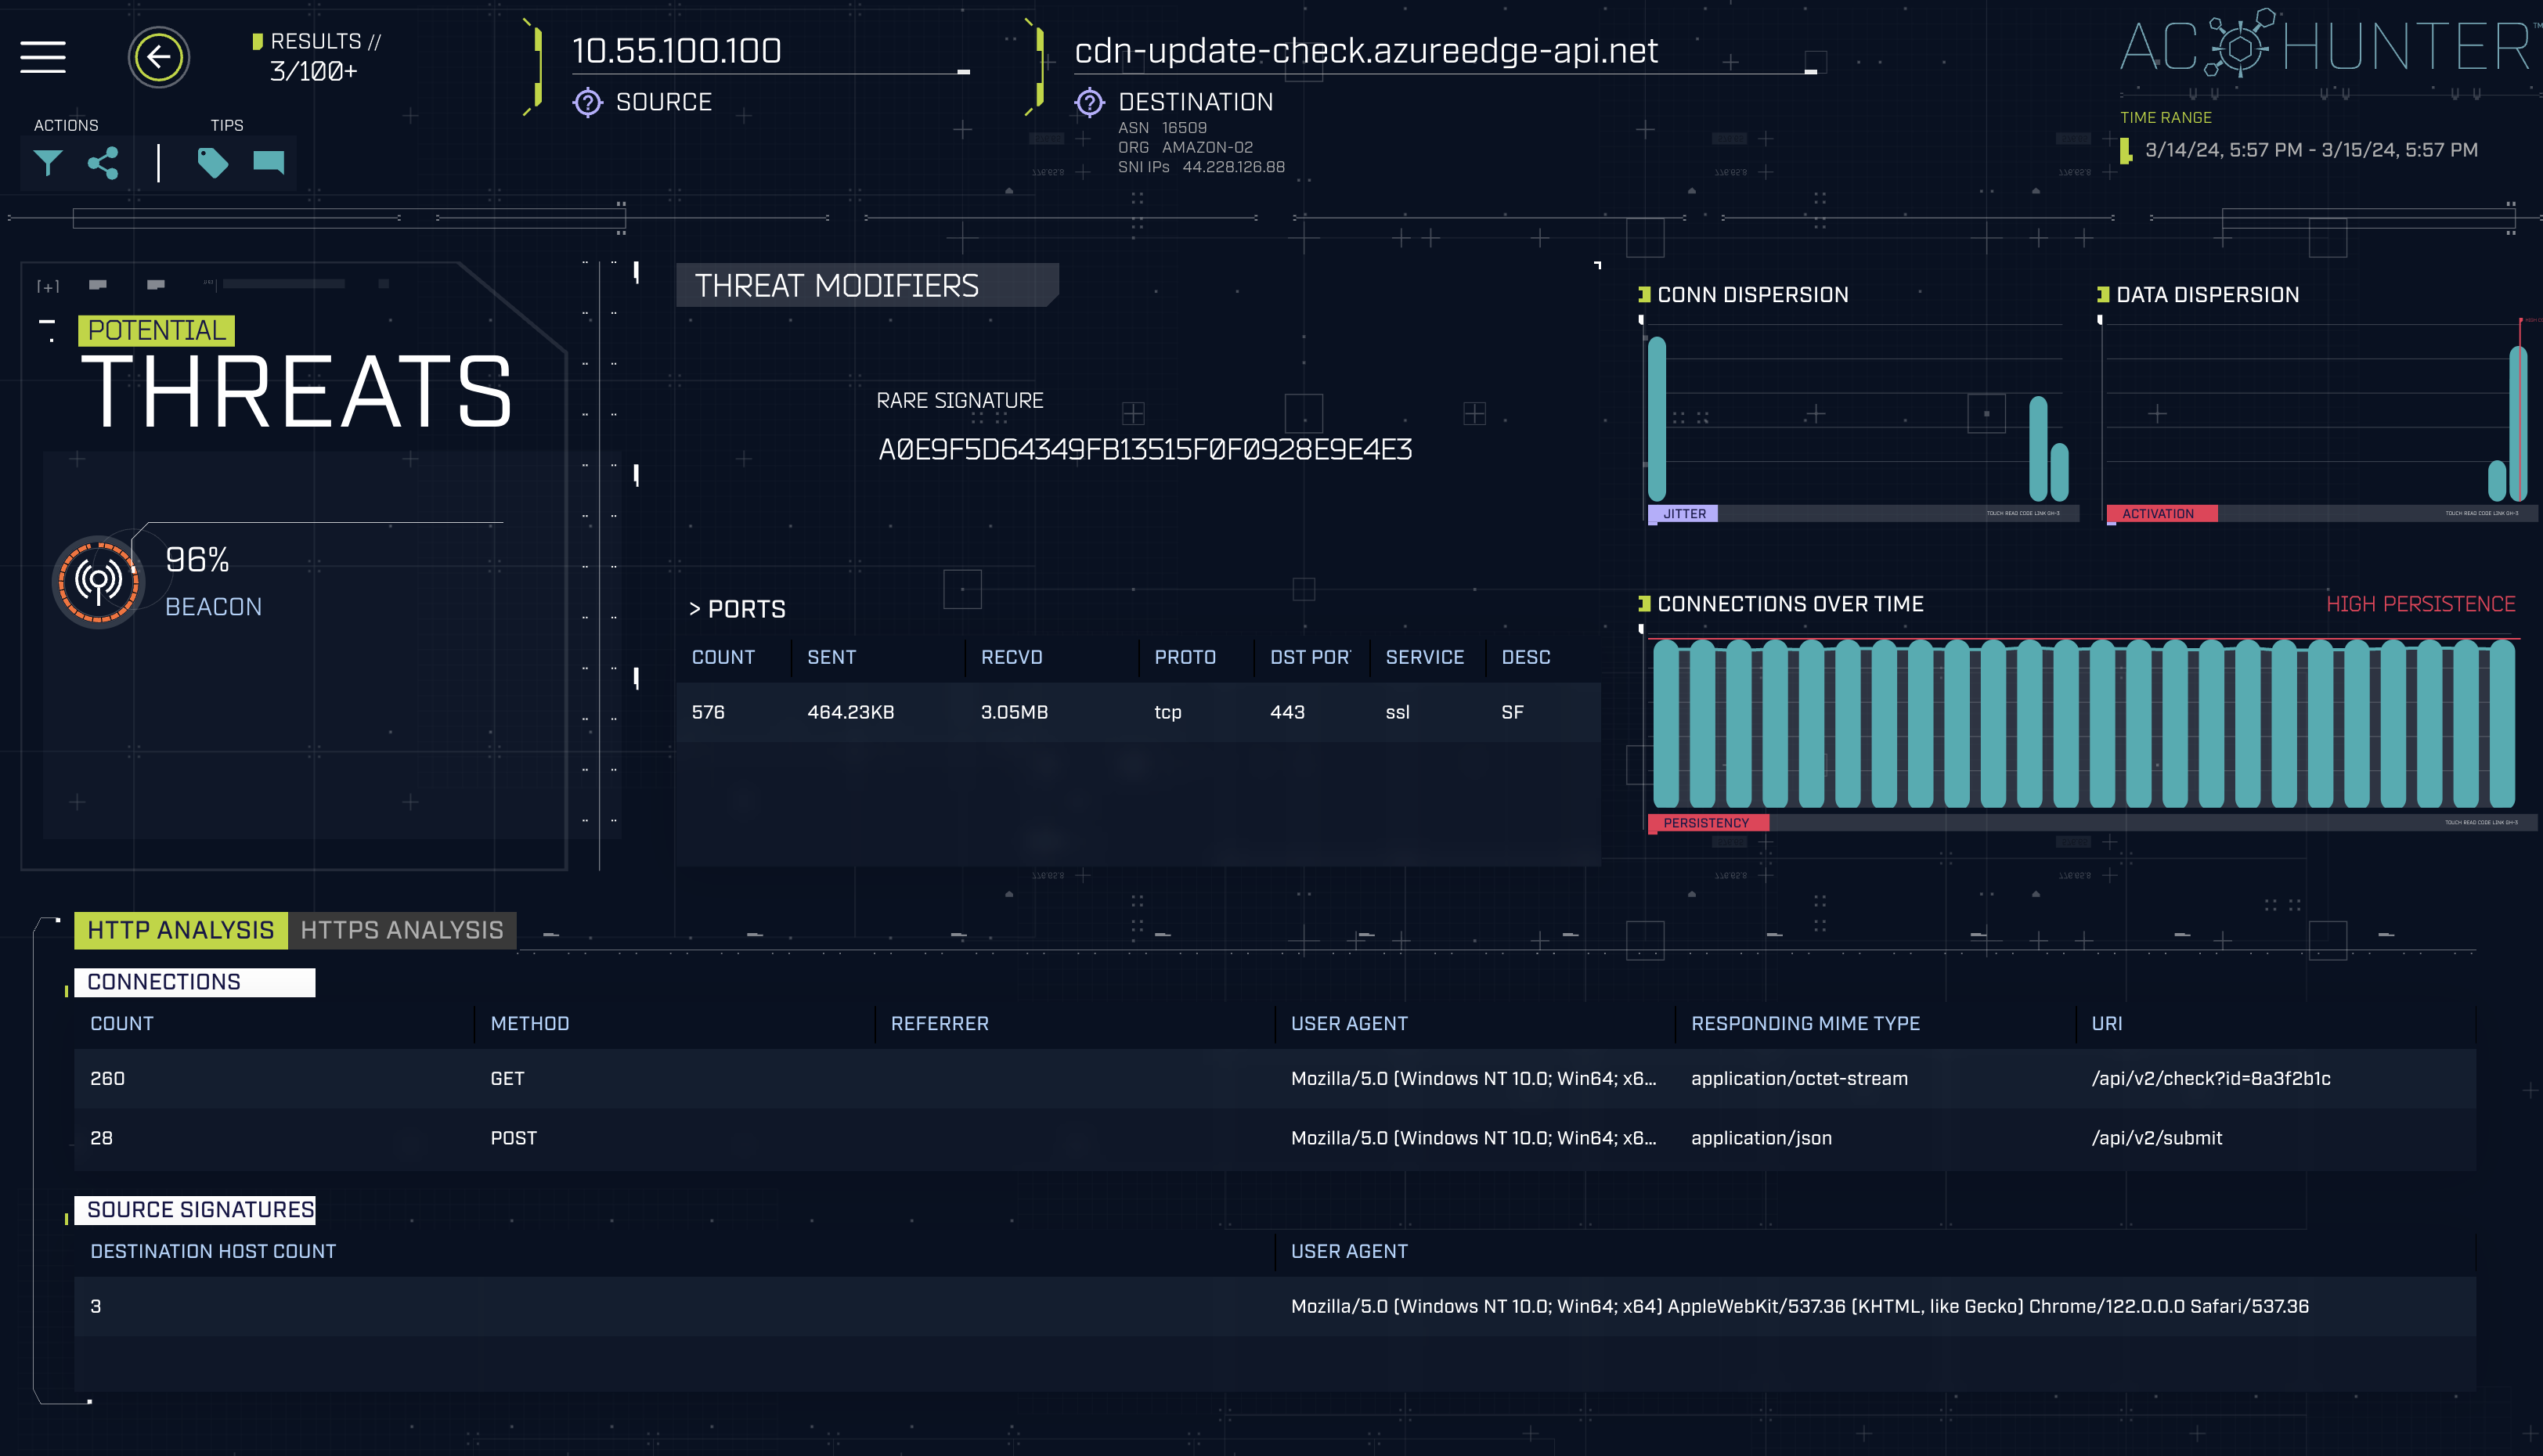
The session details view gives you:
- Threat summary: Which detection types fired (beacon, strobe, long connection, C2 over DNS, threat intel) and which modifiers influenced the score
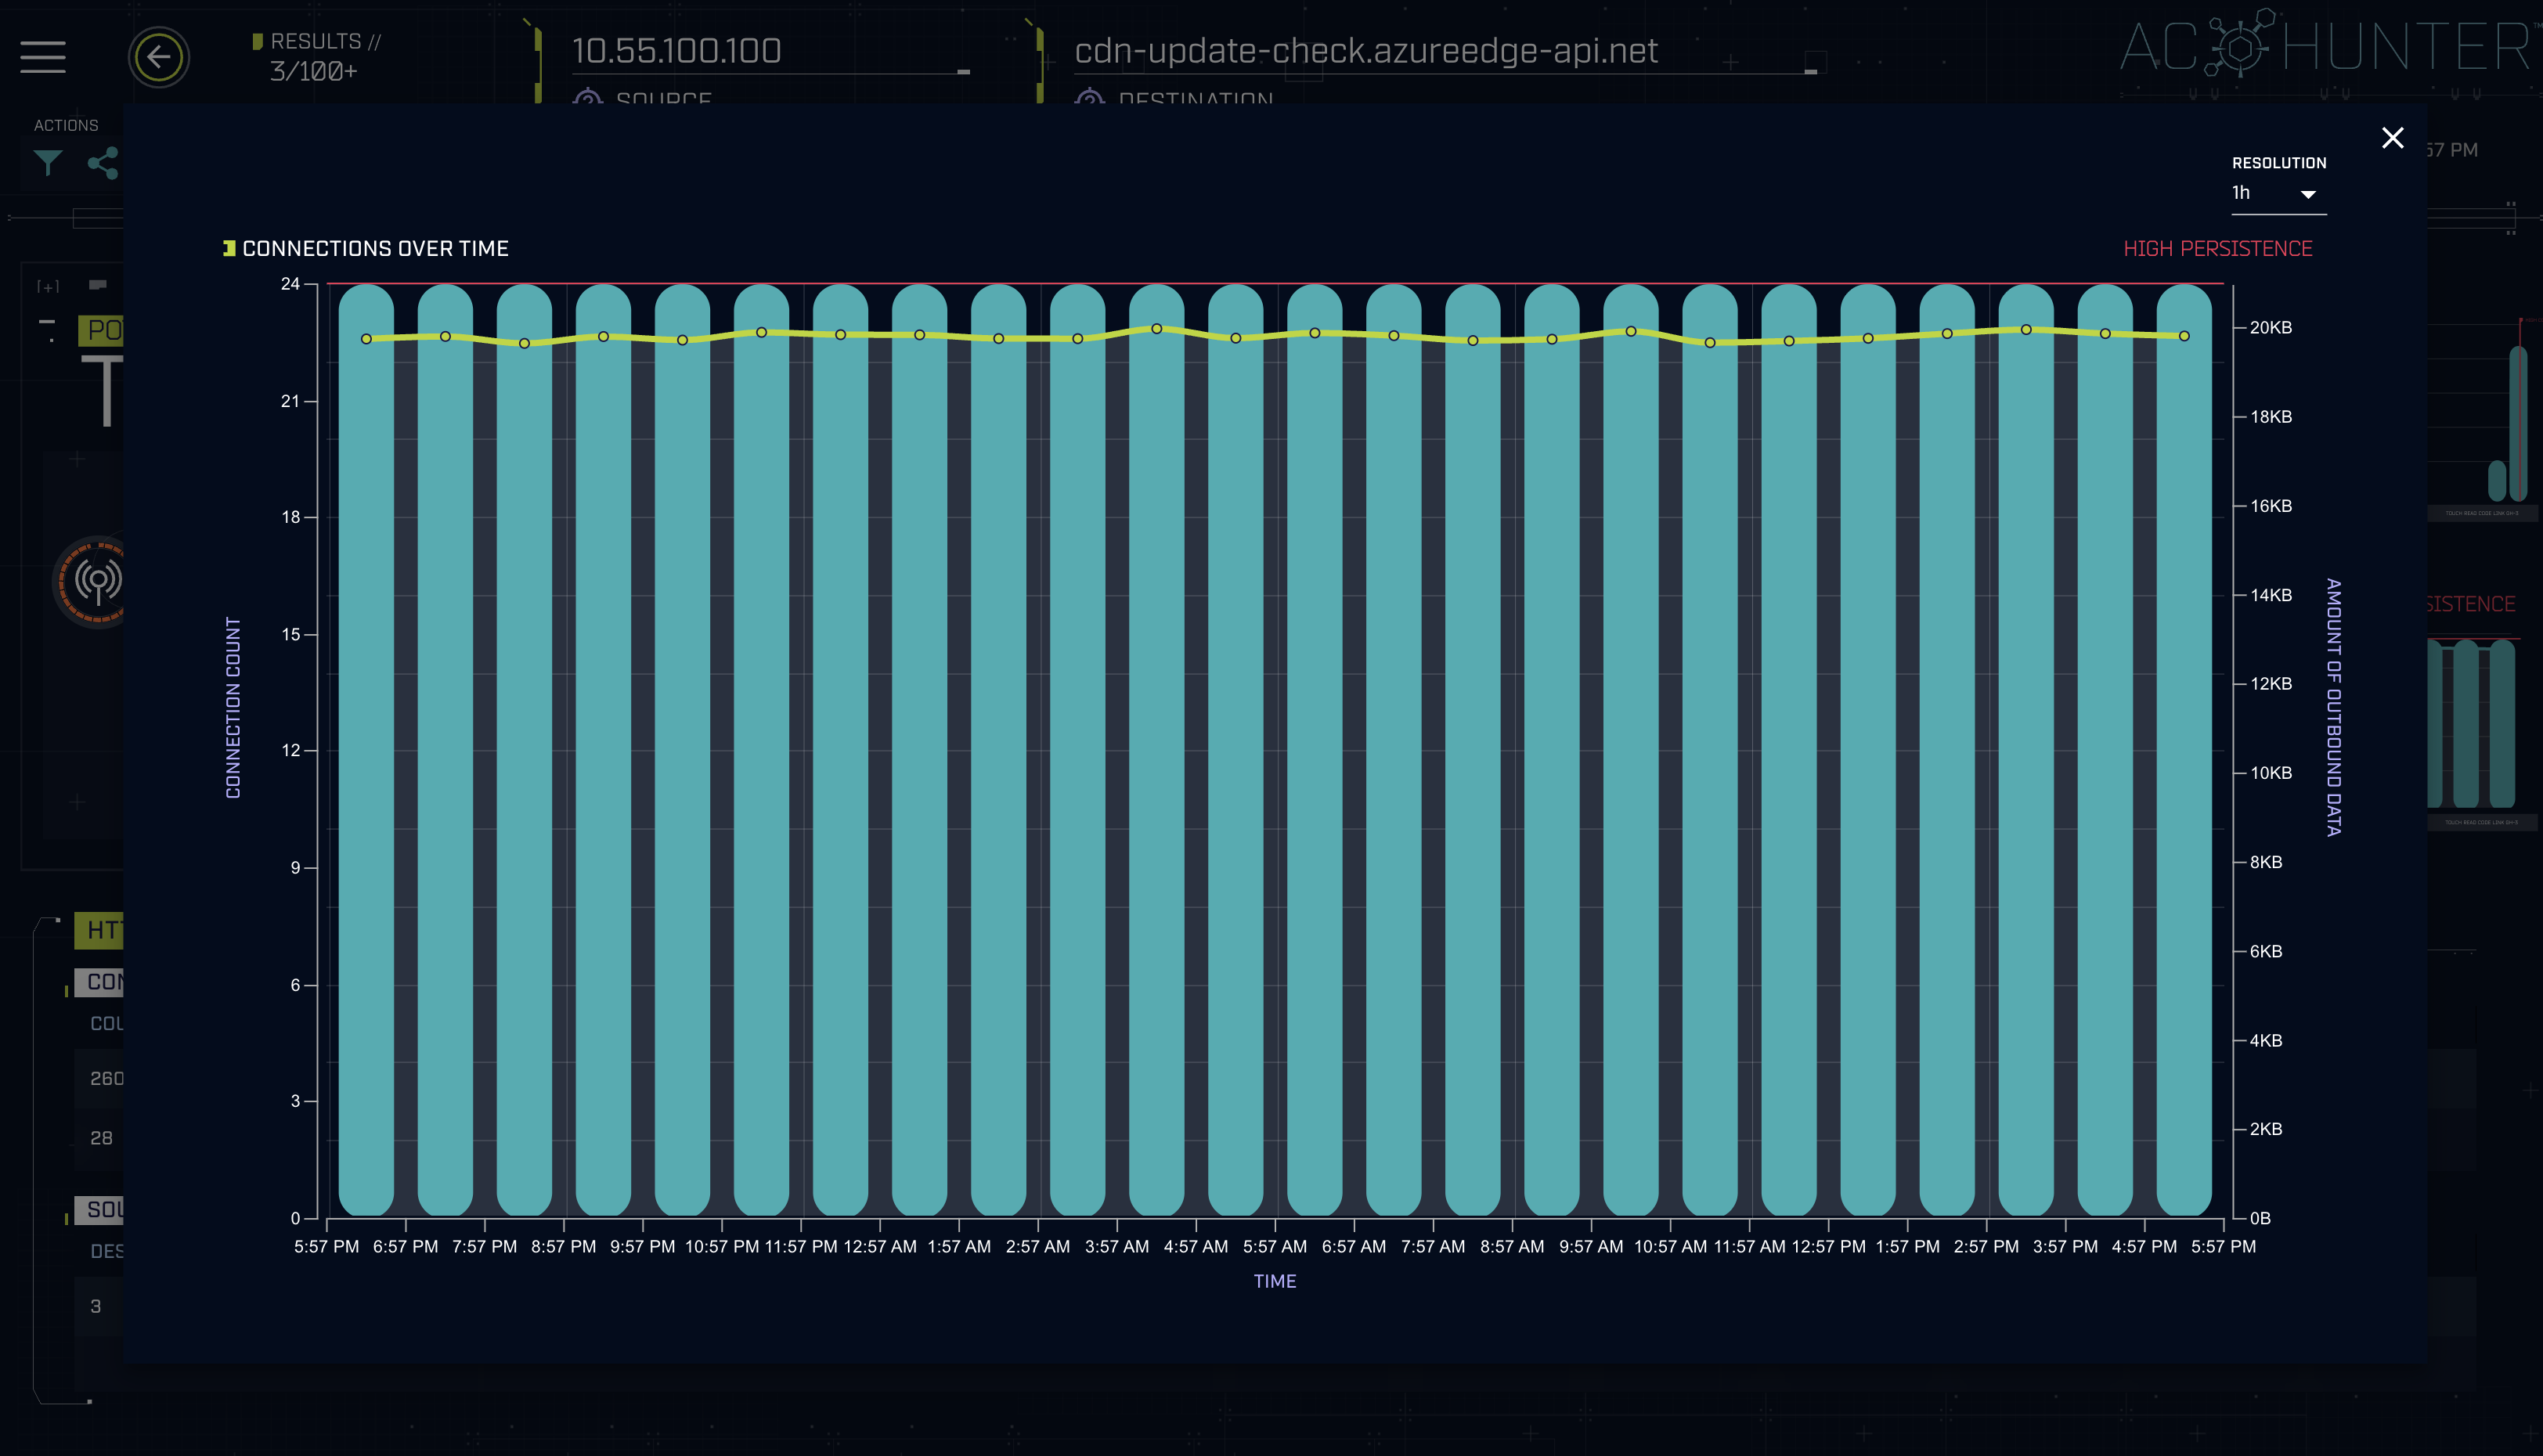
- Connection charts: Visualizations of connection timing and volume over the selected time range, helping you confirm patterns like beaconing or sustained long connections
- Protocol details: HTTP, HTTPS/TLS, and DNS analysis tables showing request-level context (user agents, JA3 hashes, queried domains, etc.)
- Investigation shortcuts: Quick links to look up the destination in external tools (e.g. VirusTotal)
- Notes and tags: Document your findings and tag the session for tracking
Click on any of the charts to open a detailed view:
Settings
Open Settings from the sidebar to configure AC-Hunter. What you can access depends on your role (admins and editors see more than read-only users).
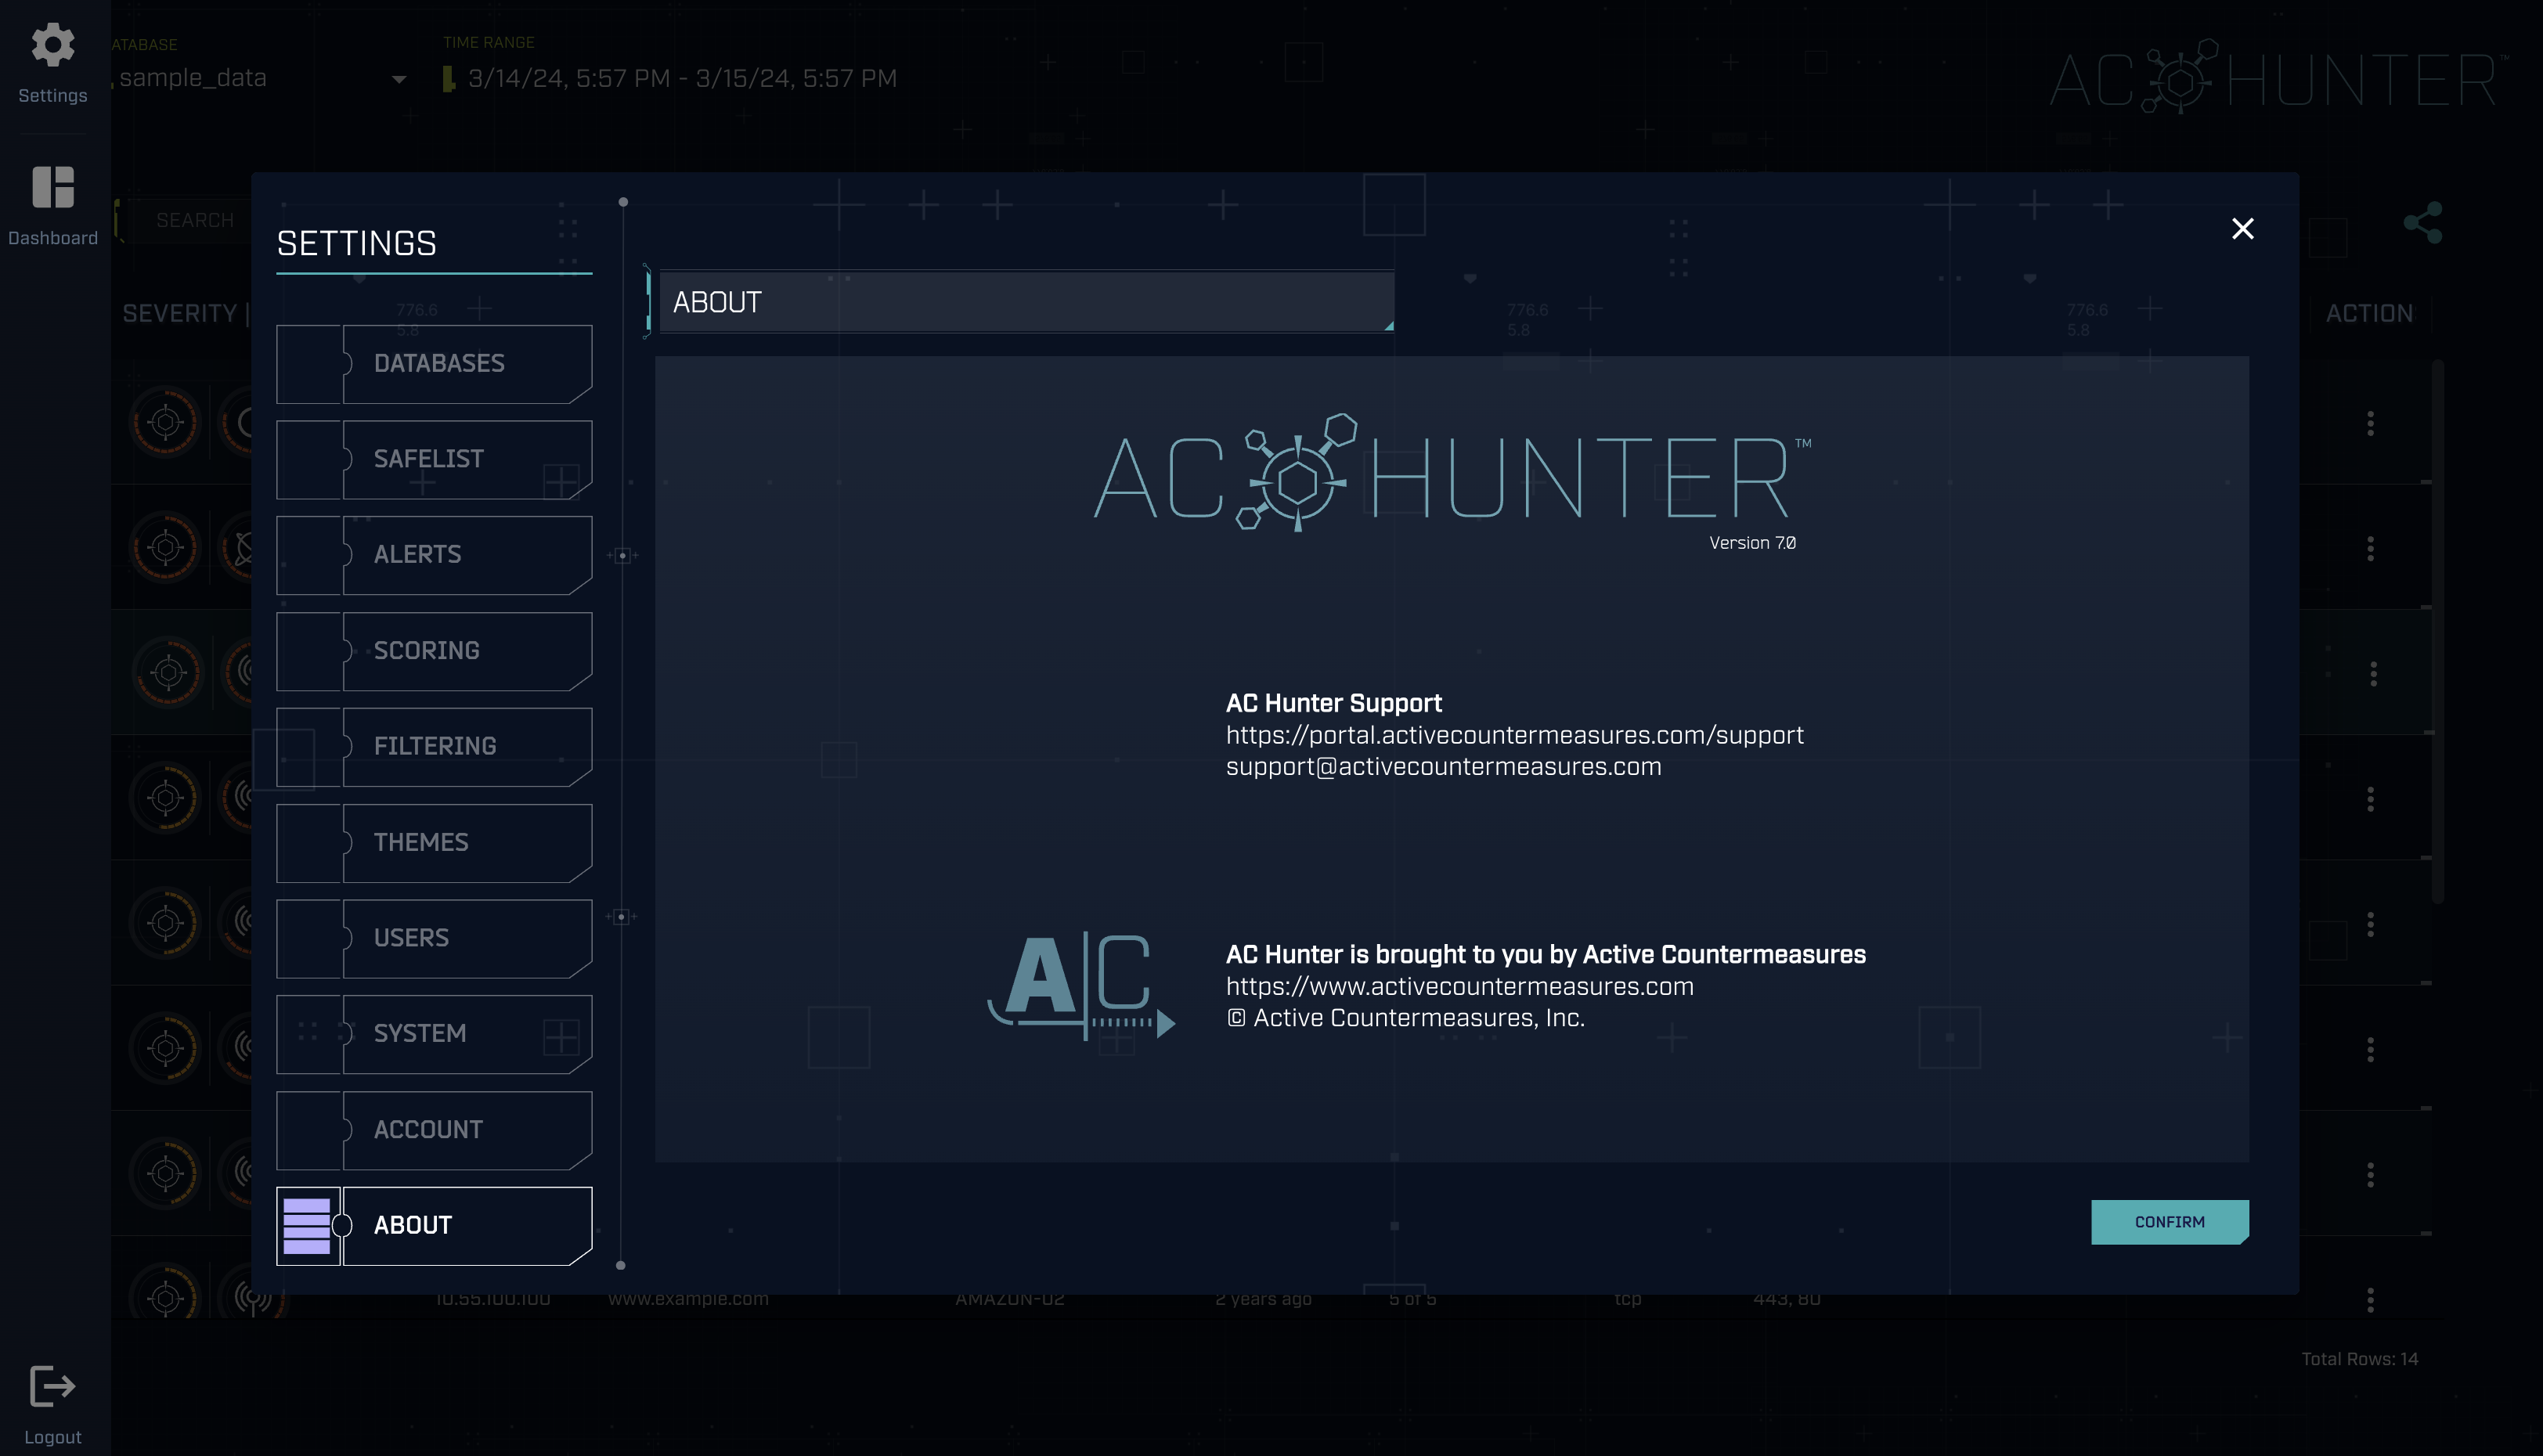
Key areas include:
- Database selection: Choose the database/sensor and manage available databases
- Global safelist: Manage IPs, FQDNs, ASNs, and other entries that should be excluded from the scored results (see Safelisting Guide)
- Alerts: Configure where AC-Hunter sends alerts (e.g. syslog) and the minimum severity threshold that triggers them
- Scoring: Tune beacon weights, long-connection thresholds, C2-over-DNS thresholds, and modifier behavior
- Filtering: Define your internal subnets so AC-Hunter correctly classifies traffic direction, and set include/exclude rules
- System: Configure a DNS zone transfer from your internal DNS server so AC-Hunter can resolve hostnames associated with internal IP addresses, making it easier to identify hosts in the Dashboard and session details
- User management: Create and manage user accounts and roles (admin only)
- Theme: Switch between different themes
- Account: Update your own profile and password
Summary
| Area | What it's for |
|---|---|
| Dashboard | Prioritized list of scored sessions; start your investigation here |
| Session details | Deep dive into a single session: charts, protocol details, and evidence behind the score |
| Settings | Configure databases, safelists, alerts, scoring, filtering, and users |